Website Heatmaps Software
For Quicker Issue Identification
View interactive visualizations of user engagement data collected from user session recordings to find out where users are clicking the most on your website.
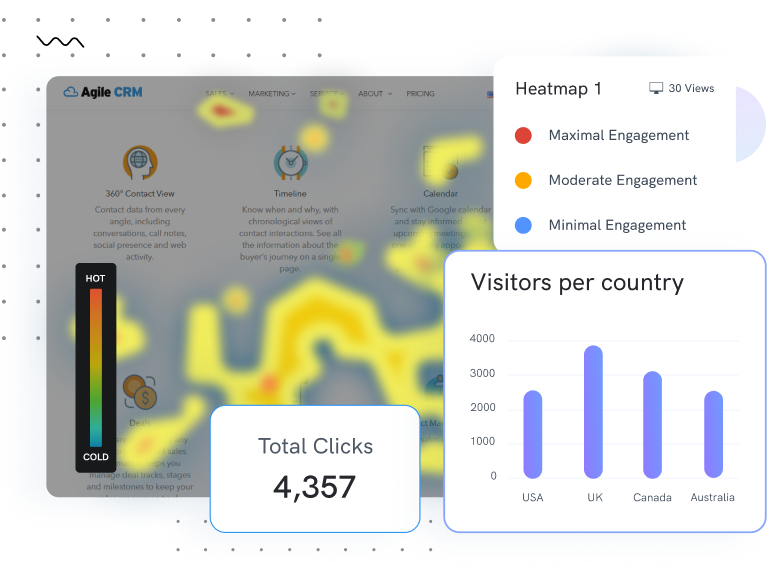
For Quicker Issue Identification
View interactive visualizations of user engagement data collected from user session recordings to find out where users are clicking the most on your website.

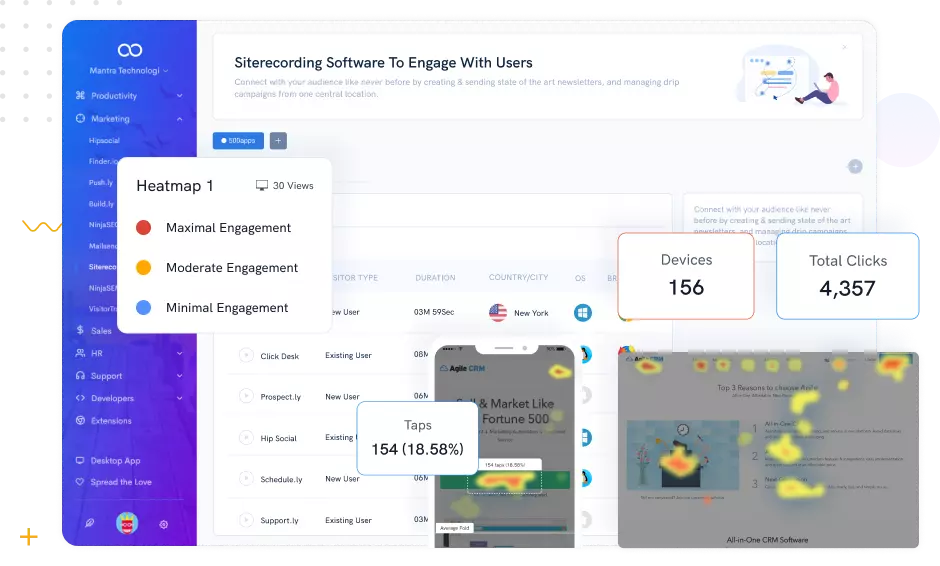
Create website heatmaps for specific pages and durations to collect data on the most and least popular parts depicted as hot and cold areas.
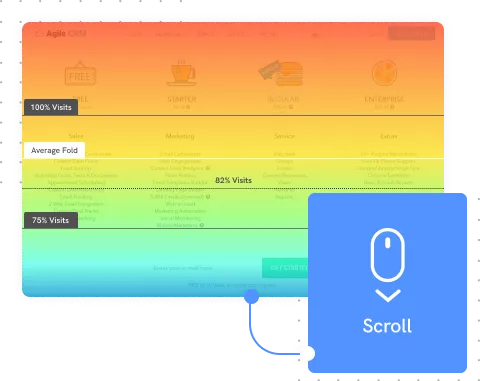
View what percentage of your visitors scroll down to which location on each page of your website. Also, see the average fold to determine what most visitors see on their screens when they open the page and before they start scrolling.
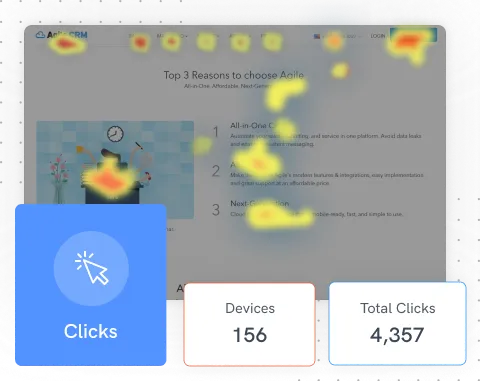
Know where your visitors click on your desktop version or the mobile version of your website, including links, buttons, images and other calls to action. Analyzing this data will help you identify opportunities for website improvements.
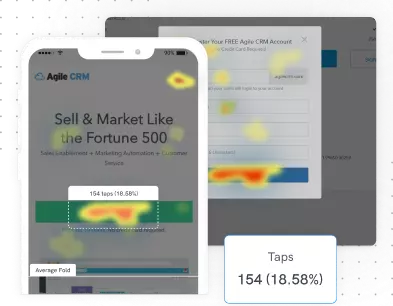
Get insights on how the website is working on mobile. Optimize the placement and size of your calls-to-action on the website by knowing where visitors' taps were not responsive.
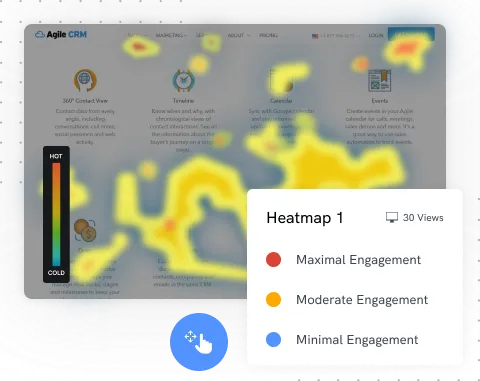
Watch where desktop users move their mouse and places they tend to pause, which can suggest to you that these are possible areas of greater interest to your visitors. Colours range from blue to red to represent these hot and cold areas.